Looker Studio reports
Create detailed, fully customizable reports in one click
Build custom dashboards, analyze surveys and create templates for future reporting using the VisitBasis / Looker Data Studio integration. Our automated reporting tool exports data from your VisitBasis account into Looker Studio, allowing you to produce reports and build visualizations in minutes.
With VisitBasis you can use adjustable parameters to analyze only what’s important to you in your surveys. Once your custom report is done, the system will automatically update it, as reps submit more field data. With our fully automated reporting tools you can forget complex spreadsheets and third-party analytics systems.
How it works:
Mobile reps can effortlessly collect data using the VisitBasis mobile app on Android or iOS phones, even if they are working without the Internet connection. Every piece of information gets automatically uploaded to your VisitBasis account and will be used when producing interactive reports in Google Looker Studio.
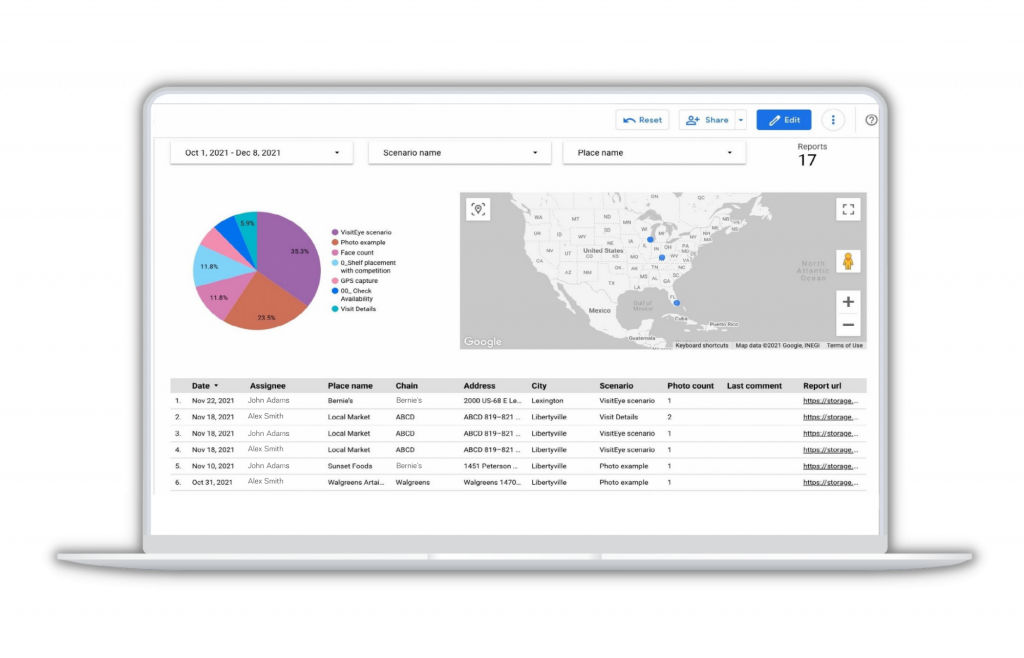
The VisitBasis integrated Looker’s Data Studio interactive reporting tool helps our customers get valuable insights without the need to use third-party systems or manually build charts.
Our dashboards are fully customizable, meaning you can select parameters to include in your reports that bring ultimate insights for your business. For example, Looker Studio can analyze information from reports filtered by assignee, scenario, place, etc.
As your agents collect more field data, the dashboards will automatically update with new information and provide you with more up-to-date market knowledge.
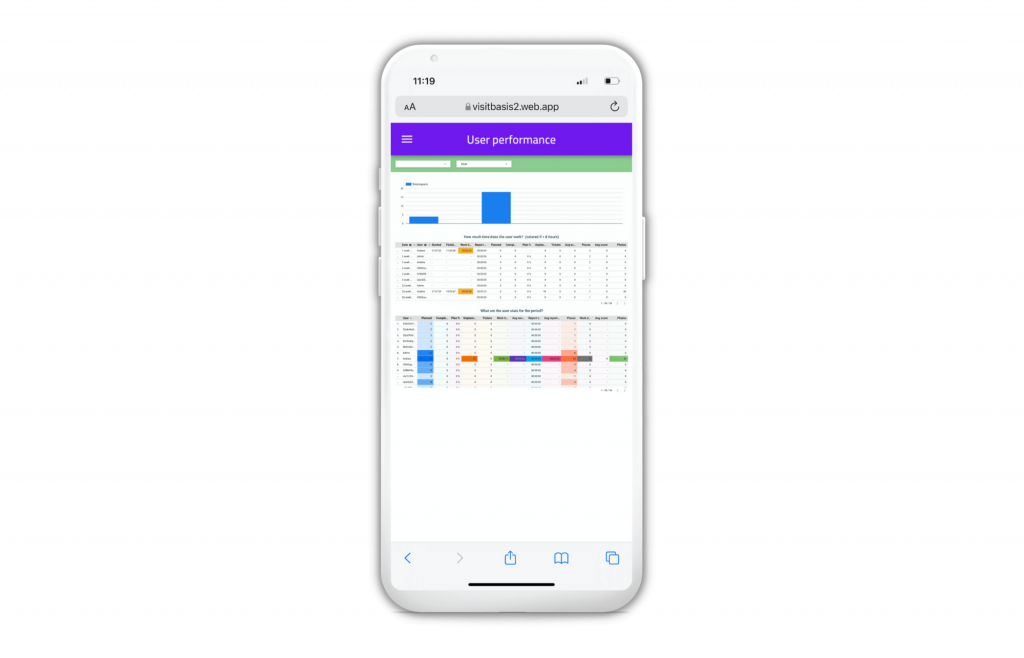
Right after reps collect data, you will be able to see ready-made reports automatically generated by our system. View timesheet, team performance, and user performance stats in your VisitBasis Dashboard with your PC, Mobile device or Tablet.
Use Looker Studio to create templates for custom reports. As soon as your report template is created, you will be able to see data visualizations and choose how you wish the information to be presented to you: charts, tables, filled map, scorecard and many other options. You can change the time frame for reports to reflect current or past trends, as well as any other parameters even after your custom dashboard has been created.
You can download your report as PDF, CSV or Excel file, share it with your colleagues via email, accessible link or invite them to work collaboratively on a report – even if they do not use VisitBasis.
Never miss new reports from your mobile agents by enabling our email notification feature. You will always receive an automated email notification along with a PDF report from VisitBasis when an agent submits a report.
Stay in touch with your agents even when they are out in the fields by enabling push-notifications. You can also leave and receive comments on every report – users will also be notified via email whenever a new comment appears.
Interested in a demo?
Would you like to see VisitBasis in action? No problem. Book an online demo and we will give you a tour of the software.