Creating Custom Reports by Product in Google Looker Studio with VisitBasis Data
The VisitBasis integration with Google Looker Studio offers a number of benefits for retail businesses. Some of these benefits include:
- Centralized reporting that can pull data from multiple sources into a single, customizable dashboard.
- Access to real-time data: this is especially useful for businesses – such as in CPG and FMCC – that need to quickly respond to changes in customer behavior or market trends.
- Customization: customize your dashboards to fit your specific needs and preferences.
- Collaboration: multiple users, even third-party stakeholders, can view and edit dashboards without having to have access to VisitBasis.
To create a custom report on Looker Studion Just follow the below steps:
- Make sure you have store data collected on one SKU Scenario.
- On VisitBasis, go to Company:
– Under “DataStudio Integration”, create a name for your integration and click on +
– Find the newly created integration and copy the key value - Go to Reports -> Downloads
Select the Scenario you want to report on and click on “DataStudio Integration” - On the LookerStudio “Untitled Data Source” window that opens up, paste the key value you copied in step 2 in the “Connector key value” field and click on “Connect”.
- In the next window, make sure all the fields you need are correct and have the correct type and default aggregation.
- Click on “Create Report” and confirm
Your Looker Studio report on VisitBasis data is now created!
Now that you have entered Looker Studio, you can work on customizing your report and dashboards:
- Rename the report by clicking on the title
- Bookmark the report so you can easily come back to it
- Add charts, and controls, and adjust fields and other parameters.
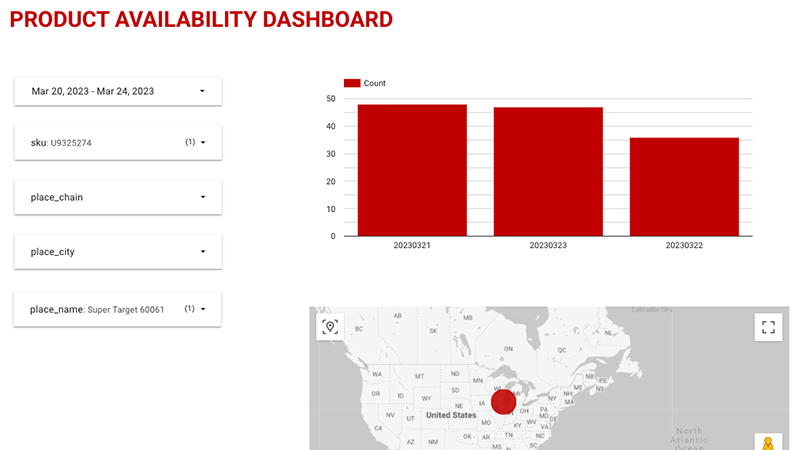
Our dashboard for the data collected on VisitBasis for a simple SKU count scenario looks like this:
We have added controls so users can filter data by date, SKU, chain, city, and/or store. With the filters apply we can immediately see the product count for one SKU at a specific store decreasing over the course of 3 days.
You can learn more by signing up for a VisitBasis account and trying out the Google Looker Studio integration for yourself. If you have not signed up for VisitBasis yet, just go to www.visitbasis.com and click on “Request a Free Trial”.